- Topic
12k Popularity
46k Popularity
22k Popularity
53k Popularity
1737k Popularity
148k Popularity
24k Popularity
120k Popularity
31k Popularity
- Pin
- Welcome Kevin_Lee to the Gate Square! 🎉
Looking forward to more great crypto insights from him.
Check out and engage with Kevin_Lee’s latest post!
👉 Post: https://www.gate.com/post/status/11758920
👉 Profile: https://www.gate.com/profile/Kevin%20Lee
Let’s give Kevin_Lee a warm welcome! 👏👏👏
- 🎯 LOT Newcomer Limited-Time Airdrop is Live!
Individual users can earn up to 1,000 LOT — share from a total prize pool of 1,000,000 LOT!
🏃 Join now: https://www.gate.com/campaigns/1294
Complete deposit and trading tasks to receive random LOT airdrops. Exclusive Alpha trading task await!🎯 LOT Newcomer Limited-Time Airdrop is Live!
Individual users can earn up to 1,000 LOT — share from a total prize pool of 1,000,000 LOT!
🏃 Join now: https://www.gate.com/campaigns/1294
Complete deposit and trading tasks to receive random LOT airdrops. Exclusive Alpha trading task await!
- 🎯 How to Earn Content Mining Rewards on Gate Post?
1️⃣ Create a post on Gate Post
2️⃣ Get likes or comments from other users
3️⃣ If those users trade (spot or futures) shortly after engaging with your post...
💰 You earn up to 10% commission on their trading fees!
📢 Share ✍️ Engage 💬 Earn 💰
- 🚀 Gate Square Creator Spark Program is Live!
We're officially recruiting the first batch of creators on Gate Square! Whether you're a crypto KOL, project team, or media outlet, join now and enjoy:
💰 Over $10,000 in monthly posting rewards
📣 Exposure to millions of Gate users
📢 Featured promotion and official support
🔥 Don't miss this early-mover advantage — apply now 👉 https://www.gate.com/questionnaire/6819
📄 More info 👉 https://www.gate.com/announcements/article/45695 - 🎉 Gate Alpha Second Points Special Airdrop is coming!
Get Token Mystery Boxes based on your Alpha Points - No points will be deducted.
📸 Alpha Points Snapshot: June 24, 16:00 (UTC)
Multi-chain trading now supported — buy on-chain assets directly with USDT!
🔗 Full details: https://www.gate.com/announcements/article/45683
Bitcoin To $150,000? Crypto Expert Identifies Pattern That Could Define Next Leg Up | Bitcoinist.com
How Bitcoin Price Could Run Up To $150,000
In a recent post on the X platform, Chartered Market Technician Tony Severino put forward an interesting analysis of the Bitcoin price. According to the crypto market expert, the price of BTC could travel as high as the $150,000 mark in its next bullish phase.
Related Reading: Bitcoin Sell-Off Warning? Miner-To-Exchange Transfers Hit Historic HighsThe reasoning behind this bullish projection is the formation of a bull flag pattern on the daily timeframe of the Bitcoin price chart. The bull flag is a technical analysis pattern characterized by a period of steep upward movement (the flagpole) typically followed by sideways or slightly downward price action.
The bull flag is typically considered a prevailing continuation pattern for an existing upward trend, suggesting a potential move to a higher price point. However, it is critical to wait for a successful break out of the consolidation before ascertaining that the price will continue in its upward trajectory.
According to Severino, the Bitcoin price could well be on its way to a new all-time high if this bull flag is valid and the price successfully breaks out of the pattern. The target for this chart pattern is usually determined by adding the vertical height of the flagpole to the potential breakout point from the flag.
What Other Indicators Are Saying
Severino highlighted another indicator and explained what it is currently saying for Bitcoin’s next leg up. For instance, the crypto expert mentioned that the Bollinger Bands are squeezing, meaning that while there is currently low market volatility, a significant price movement could be on the horizon.
Severino also mentioned that the Bitcoin price failed to reach the lower band of the Bollinger Band indicator, which could be a “Head Fake” before the flagship cryptocurrency embarks on a fresh upward run. However, investors might want to watch out for a close above the $111,000 level on the daily timeframe to confirm a potential sustained uptrend.
A close beneath the lower band, which sits just beneath the $101,000 mark, could suggest downside action for the Bitcoin price. As of this writing, the price of BTC stands above $105,000, reflecting an almost 2% increase in the past 24 hours.
Related Reading: Bitcoin Risks Deep Pullback To $96,000, But Not All Analysts Are Bearish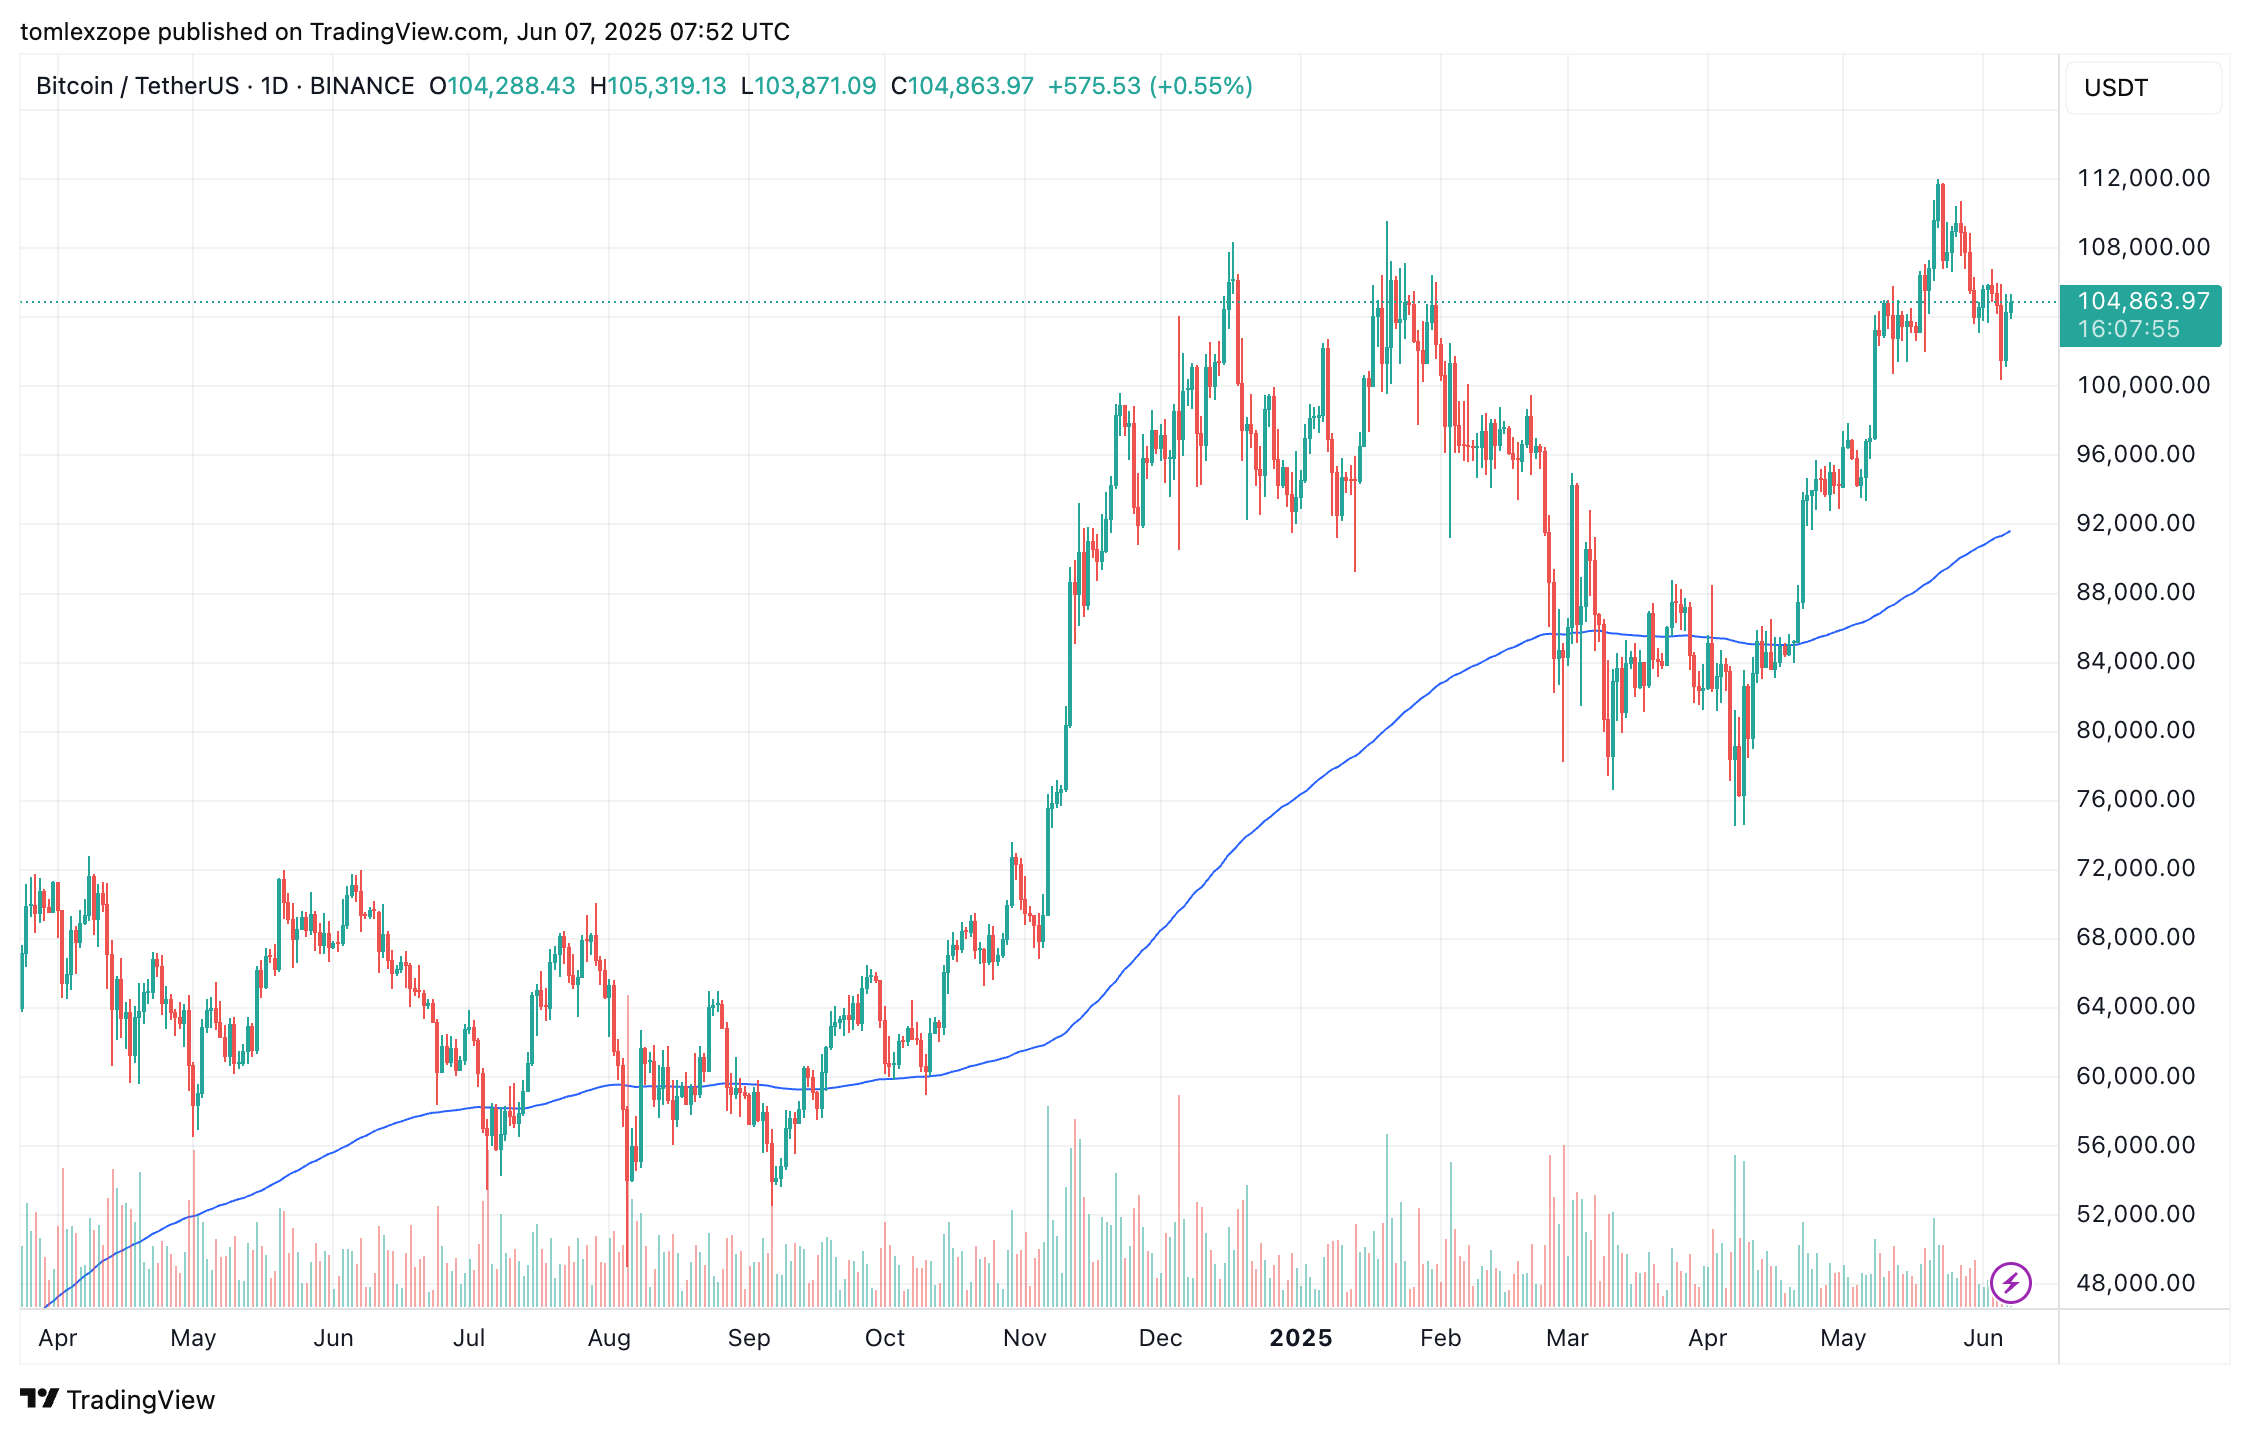
Featured image from iStock, chart from TradingView![]() Editorial Process for bitcoinist is centered on delivering thoroughly researched, accurate, and unbiased content. We uphold strict sourcing standards, and each page undergoes diligent review by our team of top technology experts and seasoned editors. This process ensures the integrity, relevance, and value of our content for our readers.
Editorial Process for bitcoinist is centered on delivering thoroughly researched, accurate, and unbiased content. We uphold strict sourcing standards, and each page undergoes diligent review by our team of top technology experts and seasoned editors. This process ensures the integrity, relevance, and value of our content for our readers.